European high-yield market coming of age: Difference between revisions
imported>Doug Williamson m (Protected "European high-yield market coming of age" ([edit=sysop] (indefinite) [move=sysop] (indefinite))) |
imported>Jeeten.patel@thinkpublishing.co.uk No edit summary |
||
| Line 21: | Line 21: | ||
|datastyle = padding-top:7px; padding-bottom:5px;; | |datastyle = padding-top:7px; padding-bottom:5px;; | ||
|header1 = | |header1 = Authors | ||
| label1 = | | label1 = | ||
| data1 = | | data1 = | ||
|header2 = | |header2 = | ||
| label2 = | | label2 =Mario Santangelo | ||
| data2 = Managing Director | | data2 =Associate Managing Director | ||
| label3 =Sandra Veseli | |||
| data3 =Managing Director | |||
Moody’s Investors Service | |||
[https://www.moodys.com/ Moody's Investors Service] | [https://www.moodys.com/ Moody's Investors Service] | ||
|belowstyle = background:#ddf; | |belowstyle = background:#ddf; | ||
| Line 33: | Line 37: | ||
==Introduction== | ==Introduction== | ||
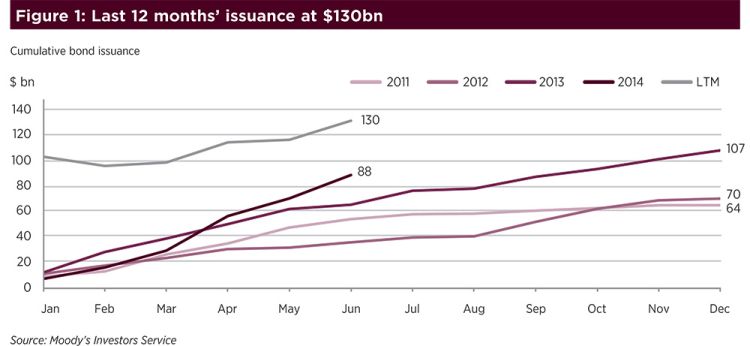
The European high-yield market has grown very strongly in recent years, with record issuance of $ | The European high-yield (‘HY’) market has grown very strongly in recent years, with record issuance of $121bn from our speculative-grade rated companies in 2014, as shown in Figure 1 below. We believe that issuance volumes will be stable in 2015, although market liquidity is less predictable than it was in 2013 and the first half of 2014, when investors’ search for yield coupled with improving macroeconomic forecasts in Europe led to a strong technical backdrop with significant capital inflows and tightening of credit spreads. | ||
| Line 44: | Line 45: | ||
In the last 12 months the market faced a number of woes, including, but not limited to, intense negotiations on a bailout plan for Greece, a slowdown in economic growth in China and heightened geopolitical risk which culminated in sanctions to Russia. Nevertheless, the market has remained open to repeat, well-known issuers and constructive towards a select number of first-time issuers with strong credit fundamentals. However, the leveraged loan market has demonstrated greater stability than the HY bond market at times of stress and volatility; as shown in Figure 2, bond volumes have been lower than that of loans in the second part of 2014, as well as in May and June of 2015. | |||
| Line 52: | Line 52: | ||
==Significant growth in volumes of HY bonds issued in the last five years== | |||
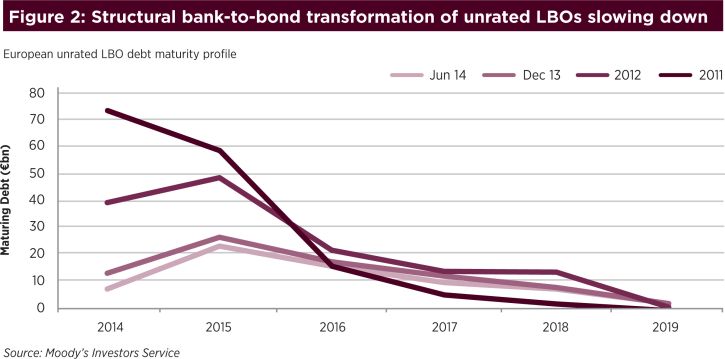
Volumes of rated HY bonds reached $121bn as of year-end 2014; this was a record year for the HY market in Europe, supported by improving macro-economic conditions and renewed interest from investors. The size of the HY bond market has effectively doubled since 2010, fuelled by the refinancing of previously unrated bank or [[CLO]http://wiki.treasurers.org/wiki/CLO]-funded leveraged buyouts (LBOs) in the capital markets. The capital structure for those companies was initially put in place in the 2005 to 2007 LBO boom. However, Figure 3 shows that this structural transformation has slowed down as it nears completion. | |||
| Line 61: | Line 61: | ||
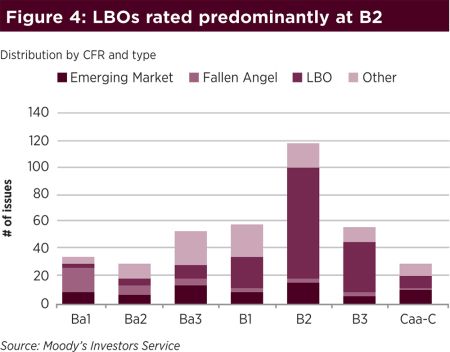
Despite this trend, Figure 4 shows a growing number of rated first-time, high-yield issuers in Europe, the Middle East and Africa that accounted for 25% of volumes in 2014, supporting our view that small- and medium-sized companies continue to transition from traditional bank-to-bond financing. However, for the high-yield market to grow this year and beyond it would require a steady volume of M&A (mergers and acquisitions)-driven issuance and primary leveraged buyouts, because the stock of debt to be refinanced has reduced compared to previous years. | |||
| Line 72: | Line 68: | ||
==More limited windows of financing opportunities in the HY bond market== | |||
We expect stable issuance volumes in 2015 because of: | |||
(i) low interest rates in the Euro area resulting in attractively low bond coupons; | |||
(ii) slowly improving macro conditions with our GDP growth expectations in the Euro area revised upward to 1.5%; | |||
(iii) investors’ continued search for yield and absolute returns supporting demand for HY bonds and, (iv) M&A-driven issuance. | |||
At the same time, the liquidity of the HY market is likely to be more volatile because of a growing number of negative catalysts. In January and February the market paused, waiting for details of the Quantitative Easing (QE) programme by the European Central Bank. In May the market took another breath in light of the elections in the UK and the intensifying debate around a potential ‘Brexit’ and, most recently, in July the HY bond market completely shut for two weeks amid concerns around the resolution of the Greek financial crisis. | |||
As a result, in the first half of 2015 the volatility of credit spreads kept new issuers on the sideline which, coupled with a lack of supply from private equity sponsored LBO deals has caused a 36% decline in HY bond volumes to $59bn as shown in Figure 5. There were only 13 new issuers in the first half of the year compared to 36 in the same period of 2014. The market has been dominated by repeat issuers, especially those rated in the Ba category, that have refinanced outstanding bonds at lower coupons. | |||
[[Category:Book_Export]] | [[Category:Book_Export]] | ||
Revision as of 00:04, 7 November 2015
| Corporate finance | |
|---|---|
 | |
| Authors | |
| Mario Santangelo | Associate Managing Director |
| Sandra Veseli |
Managing Director Moody’s Investors Service Moody's Investors Service |
Introduction
The European high-yield (‘HY’) market has grown very strongly in recent years, with record issuance of $121bn from our speculative-grade rated companies in 2014, as shown in Figure 1 below. We believe that issuance volumes will be stable in 2015, although market liquidity is less predictable than it was in 2013 and the first half of 2014, when investors’ search for yield coupled with improving macroeconomic forecasts in Europe led to a strong technical backdrop with significant capital inflows and tightening of credit spreads.

In the last 12 months the market faced a number of woes, including, but not limited to, intense negotiations on a bailout plan for Greece, a slowdown in economic growth in China and heightened geopolitical risk which culminated in sanctions to Russia. Nevertheless, the market has remained open to repeat, well-known issuers and constructive towards a select number of first-time issuers with strong credit fundamentals. However, the leveraged loan market has demonstrated greater stability than the HY bond market at times of stress and volatility; as shown in Figure 2, bond volumes have been lower than that of loans in the second part of 2014, as well as in May and June of 2015.

Significant growth in volumes of HY bonds issued in the last five years
Volumes of rated HY bonds reached $121bn as of year-end 2014; this was a record year for the HY market in Europe, supported by improving macro-economic conditions and renewed interest from investors. The size of the HY bond market has effectively doubled since 2010, fuelled by the refinancing of previously unrated bank or [[CLO]http://wiki.treasurers.org/wiki/CLO]-funded leveraged buyouts (LBOs) in the capital markets. The capital structure for those companies was initially put in place in the 2005 to 2007 LBO boom. However, Figure 3 shows that this structural transformation has slowed down as it nears completion.

Despite this trend, Figure 4 shows a growing number of rated first-time, high-yield issuers in Europe, the Middle East and Africa that accounted for 25% of volumes in 2014, supporting our view that small- and medium-sized companies continue to transition from traditional bank-to-bond financing. However, for the high-yield market to grow this year and beyond it would require a steady volume of M&A (mergers and acquisitions)-driven issuance and primary leveraged buyouts, because the stock of debt to be refinanced has reduced compared to previous years.

More limited windows of financing opportunities in the HY bond market
We expect stable issuance volumes in 2015 because of:
(i) low interest rates in the Euro area resulting in attractively low bond coupons; (ii) slowly improving macro conditions with our GDP growth expectations in the Euro area revised upward to 1.5%; (iii) investors’ continued search for yield and absolute returns supporting demand for HY bonds and, (iv) M&A-driven issuance.
At the same time, the liquidity of the HY market is likely to be more volatile because of a growing number of negative catalysts. In January and February the market paused, waiting for details of the Quantitative Easing (QE) programme by the European Central Bank. In May the market took another breath in light of the elections in the UK and the intensifying debate around a potential ‘Brexit’ and, most recently, in July the HY bond market completely shut for two weeks amid concerns around the resolution of the Greek financial crisis.
As a result, in the first half of 2015 the volatility of credit spreads kept new issuers on the sideline which, coupled with a lack of supply from private equity sponsored LBO deals has caused a 36% decline in HY bond volumes to $59bn as shown in Figure 5. There were only 13 new issuers in the first half of the year compared to 36 in the same period of 2014. The market has been dominated by repeat issuers, especially those rated in the Ba category, that have refinanced outstanding bonds at lower coupons.
